

How it is calculated
Example
Your project collected 200 answers in the last 30 days. 58 of them name your brand.Where you see it
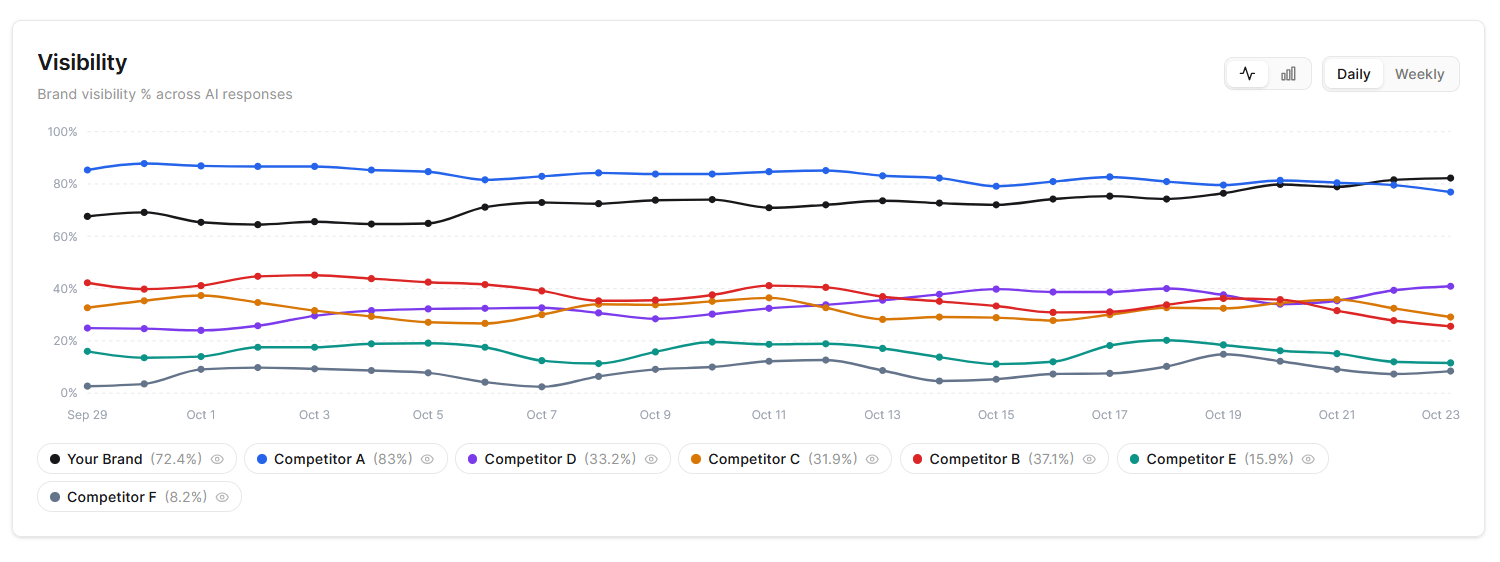
- Dashboard: the Visibility chart plots your brand and up to six tracked competitors over time, daily or weekly. See Dashboard.
- Platform Breakdown: Visibility per AI platform, so you can see where you are strong and where you are absent.
- Topics and Prompts: Visibility for each topic and prompt, plus a chart on every topic and prompt detail page.
Reading it well
- Compare like with like. Visibility depends heavily on which prompts you track. A project full of prompts that include your brand name will score far higher than one built on generic category questions. Track both kinds, and compare topics rather than the overall number when you change your setup.
- Filter by AI platform. An overall 30% can hide 60% on Perplexity and 5% on Google AI Overviews. Each platform draws on different sources, so they need different fixes.
- Watch the trend, not a single day. AI answers vary from one run to the next. A move of a few points in a day is normal; a steady climb or slide over weeks is a signal.
Put it to work
- Sort Topics by Visibility to find subjects where you are rarely named. Those are your biggest opportunities.
- On a low-visibility prompt, open the chats and look at which brands are named instead of you and which sources the answers cite.
- Use the Citations page to find domains with a high gap score: sites that AI platforms read and that name your competitors. Getting covered on those sites is one of the most direct ways to raise Visibility.
Related metrics
Share of Voice
Your slice of all brand mentions.
Average Position
How early you are named.
Citation Rate
How often your site is a source.